Description
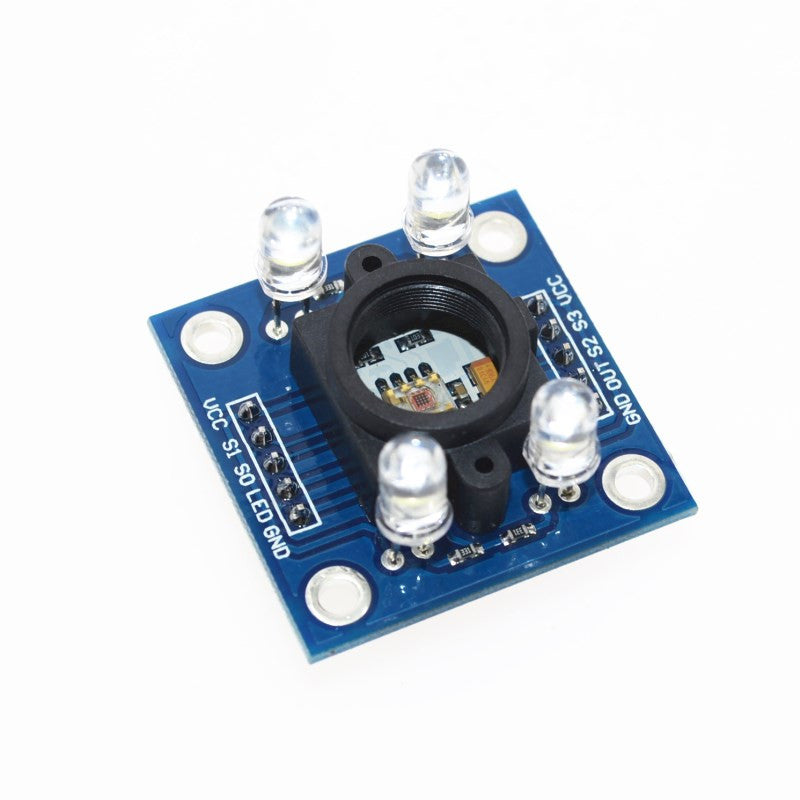
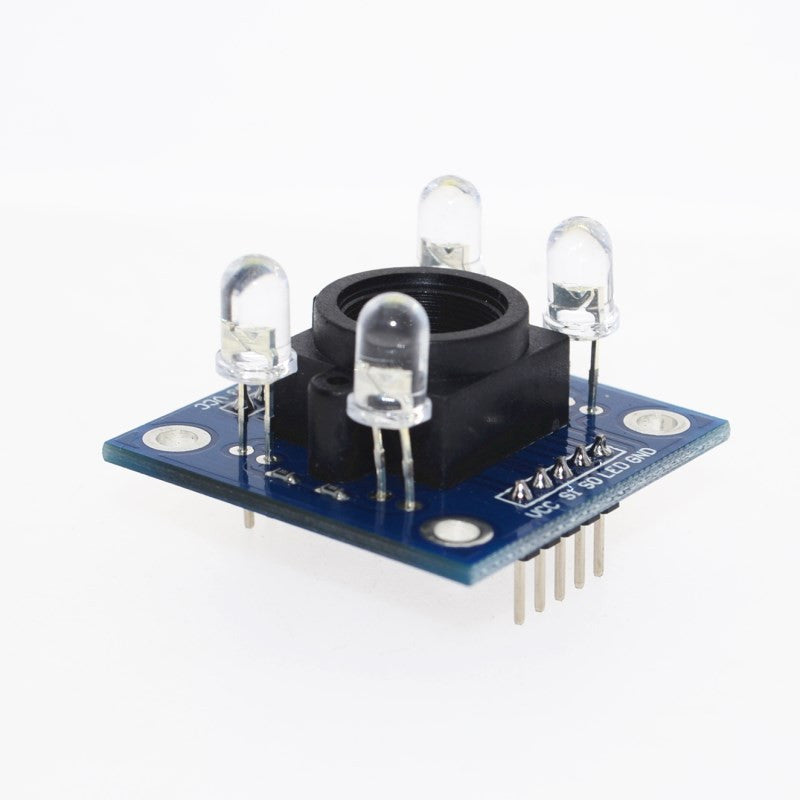
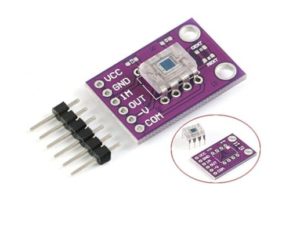
- This is Color Sensor Module is made using IC TCS320, programmable color light to frequency converter.
- It has configurable silicon photodiodes and a current to frequency converter in a single monlithic CMOS Integrated Circuit.
- Its output is square wave having 50% duty cycle with frequency directly proportional to irradiance (light intensity).
- This module can be directly interfaced with Microcontrollers, Arduino Boards, Raspberry Pi etc.
- Input voltage: DC 3 – 5V
- Use bright white LED lights
Getting started with the Colour Recognition Sensor
In this example you’re going to detect colors with the Arduino and the TCSP3200 color sensor. This sensor is not very accurate, but works fine for detecting colors in simple projects.
How does the TCS3200 sensor work?
The TCS3200 has an array of photodiodes with 4 different filters. A photodiode is simply a semiconductor device that converts light into current. The sensor has:
- 16 photodiodes with red filter – sensitive to red wavelength
- 16 photodiodes with green filter – sensitive to green wavelength
- 16 photodiodes with blue filter – sensitive to blue wavelength
- 16 photodiodes without filter
If you take a closer look at the TCS3200 chip you can see the different filters.

By selectively choosing the photodiode filter’s readings, you’re able to detect the intensity of the different colors. The sensor has a current-to-frequency converter that converts the photodiodes’ readings into a square wave with a frequency that is proportional to the light intensity of the chosen color. This frequency is then, read by the Arduino – this is shown in the figure below.

Pinout
Here’s the sensor pinout:

| Pin Name | I/O | Description |
| GND (4) | Power supply ground | |
| OE (3) | I | Enable for output frequency (active low) |
| OUT (6) | O | Output frequency |
| S0, S1(1,2) | I | Output frequency scaling selection inputs |
| S2, S3(7,8) | I | Photodiode type selection inputs |
| VDD(5) | Voltage supply |
Filter selection
To select the color read by the photodiode, you use the control pins S2 and S3. As the photodiodes are connected in parallel, setting the S2 and S3 LOW and HIGH in different combinations allows you to select different photodidodes. Take a look at the table below:
| Photodiode type | S2 | S3 |
| Red | LOW | LOW |
| Blue | LOW | HIGH |
| No filter (clear) | HIGH | LOW |
| Green | HIGH | HIGH |
Frequency scaling
Pins S0 and S1 are used for scaling the output frequency. It can be scaled to the following preset values: 100%, 20% or 2%. Scaling the output frequency is useful to optimize the sensor readings for various frequency counters or microcontrollers. Take a look at the table below:
| Output frequency scaling | S0 | S1 |
| Power down | L | L |
| 2% | L | H |
| 20% | H | L |
| 100% | H | H |
For the Arduino, it is common to use a frequency scaling of 20%. So, you set the S0 pin to HIGH and the S1 pin to LOW.
Hardware required
Connecting the Hardware
Wiring the TCSP3200 sensor to your Arduino is pretty straightforward. Simply follow the next schematic diagram.

Here’s the connections between the TCSP3200 and the Arduino:
- S0: digital pin 4
- S1: digital pin 5
- VCC: 5V
- S3: digital pin 6
- S4: digital pin 7
- OUT: digital pin 8
Code
You need two sketches for this project:
- Reading and displaying the output frequency on the serial monitor. In this part you need to write down the frequency values when you place different colors in front of the sensor.
- Distinguish between different colors. In this section you’ll insert the frequency values picked previously on your code, so that your sensor can distinguish between different colors. We’ll detect red, green and blue colors.
1. Reading the output frequency
Upload the following code to your Arduino board.
// TCS230 or TCS3200 pins wiring to Arduino
#define S0 4
#define S1 5
#define S2 6
#define S3 7
#define sensorOut 8
// Stores frequency read by the photodiodes
int redFrequency = 0;
int greenFrequency = 0;
int blueFrequency = 0;
void setup() {
// Setting the outputs
pinMode(S0, OUTPUT);
pinMode(S1, OUTPUT);
pinMode(S2, OUTPUT);
pinMode(S3, OUTPUT);
// Setting the sensorOut as an input
pinMode(sensorOut, INPUT);
// Setting frequency scaling to 20%
digitalWrite(S0,HIGH);
digitalWrite(S1,LOW);
// Begins serial communication
Serial.begin(9600);
}
void loop() {
// Setting RED (R) filtered photodiodes to be read
digitalWrite(S2,LOW);
digitalWrite(S3,LOW);
// Reading the output frequency
redFrequency = pulseIn(sensorOut, LOW);
// Printing the RED (R) value
Serial.print(“R = “);
Serial.print(redFrequency);
delay(100);
// Setting GREEN (G) filtered photodiodes to be read
digitalWrite(S2,HIGH);
digitalWrite(S3,HIGH);
// Reading the output frequency
greenFrequency = pulseIn(sensorOut, LOW);
// Printing the GREEN (G) value
Serial.print(” G = “);
Serial.print(greenFrequency);
delay(100);
// Setting BLUE (B) filtered photodiodes to be read
digitalWrite(S2,LOW);
digitalWrite(S3,HIGH);
// Reading the output frequency
blueFrequency = pulseIn(sensorOut, LOW);
// Printing the BLUE (B) value
Serial.print(” B = “);
Serial.println(blueFrequency);
delay(100);
}
Open the serial monitor at a baud rate of 9600.
Place a blue object in front of the sensor at different distances. You should save two measurements: when the object is placed far from the sensor and when the object is close to it.


Check the values displayed on the serial monitor. The blue frequency (B) should be the lowest compared to the red (R) and green (G) frequency readings – see figure below.

When we place the blue object in front of the sensor, the blue frequency (B) values oscillate between 59 and 223 (see highlighted values).
Note: you can’t use these frequency values (59 and 223) in your code, you should measure the colors for your specific object with your own color sensor. Then, save your upper and bottom frequency limits for the blue color, because you’ll need them later.
Repeat this process with a green and red objects and write down the upper and bottom frequency limits for each color.
Distinguish between different color
In this part you need to write down the frequency values when you place different colors in front of the sensor.
This next sketch maps the frequency values to RGB values (that are between 0 and 255).
In the previous step when we have maximum blue we obtained a frequency of 59 and when we have blue at a higher distance we obtained 223.
So, 59 in frequency corresponds to 255 (in RGB) and 223 in frequency to 0 (in RGB). We’ll do this with the Arduino map() function. In the map() function you need to replace XX parameters with your own values.
CODE
// TCS230 or TCS3200 pins wiring to Arduino
#define S0 4
#define S1 5
#define S2 6
#define S3 7
#define sensorOut 8
// Stores frequency read by the photodiodes
int redFrequency = 0;
int greenFrequency = 0;
int blueFrequency = 0;
// Stores the red. green and blue colors
int redColor = 0;
int greenColor = 0;
int blueColor = 0;
void setup() {
// Setting the outputs
pinMode(S0, OUTPUT);
pinMode(S1, OUTPUT);
pinMode(S2, OUTPUT);
pinMode(S3, OUTPUT);
// Setting the sensorOut as an input
pinMode(sensorOut, INPUT);
// Setting frequency scaling to 20%
digitalWrite(S0,HIGH);
digitalWrite(S1,LOW);
// Begins serial communication
Serial.begin(9600);
}
void loop() {
// Setting RED (R) filtered photodiodes to be read
digitalWrite(S2,LOW);
digitalWrite(S3,LOW);
// Reading the output frequency
redFrequency = pulseIn(sensorOut, LOW);
// Remaping the value of the RED (R) frequency from 0 to 255
// You must replace with your own values. Here’s an example:
// redColor = map(redFrequency, 70, 120, 255,0);
redColor = map(redFrequency, XX, XX, 255,0);
// Printing the RED (R) value
Serial.print(“R = “);
Serial.print(redColor);
delay(100);
// Setting GREEN (G) filtered photodiodes to be read
digitalWrite(S2,HIGH);
digitalWrite(S3,HIGH);
// Reading the output frequency
greenFrequency = pulseIn(sensorOut, LOW);
// Remaping the value of the GREEN (G) frequency from 0 to 255
// You must replace with your own values. Here’s an example:
// greenColor = map(greenFrequency, 100, 199, 255, 0);
greenColor = map(greenFrequency, XX, XX, 255, 0);
// Printing the GREEN (G) value
Serial.print(” G = “);
Serial.print(greenColor);
delay(100);
// Setting BLUE (B) filtered photodiodes to be read
digitalWrite(S2,LOW);
digitalWrite(S3,HIGH);
// Reading the output frequency
blueFrequency = pulseIn(sensorOut, LOW);
// Remaping the value of the BLUE (B) frequency from 0 to 255
// You must replace with your own values. Here’s an example:
// blueColor = map(blueFrequency, 38, 84, 255, 0);
blueColor = map(blueFrequency, XX, XX, 255, 0);
// Printing the BLUE (B) value
Serial.print(” B = “);
Serial.print(blueColor);
delay(100);
// Checks the current detected color and prints
// a message in the serial monitor
if(redColor > greenColor && redColor > blueColor){
Serial.println(” – RED detected!”);
}
if(greenColor > redColor && greenColor > blueColor){
Serial.println(” – GREEN detected!”);
}
if(blueColor > redColor && blueColor > greenColor){
Serial.println(” – BLUE detected!”);
}
}
To distinguish between different colors we have three conditions:
- When the R is the maximum value (in RGB parameters) we know we have a red object
- When G is the maximum value, we know we have a green object
- When B is the maximum value, we know we have a blue object
Now, place something in front of the sensor. It should print in your serial monitor the color detected: red, green or blue.
Tip: your sensor can also detect other colors with more if statements.


